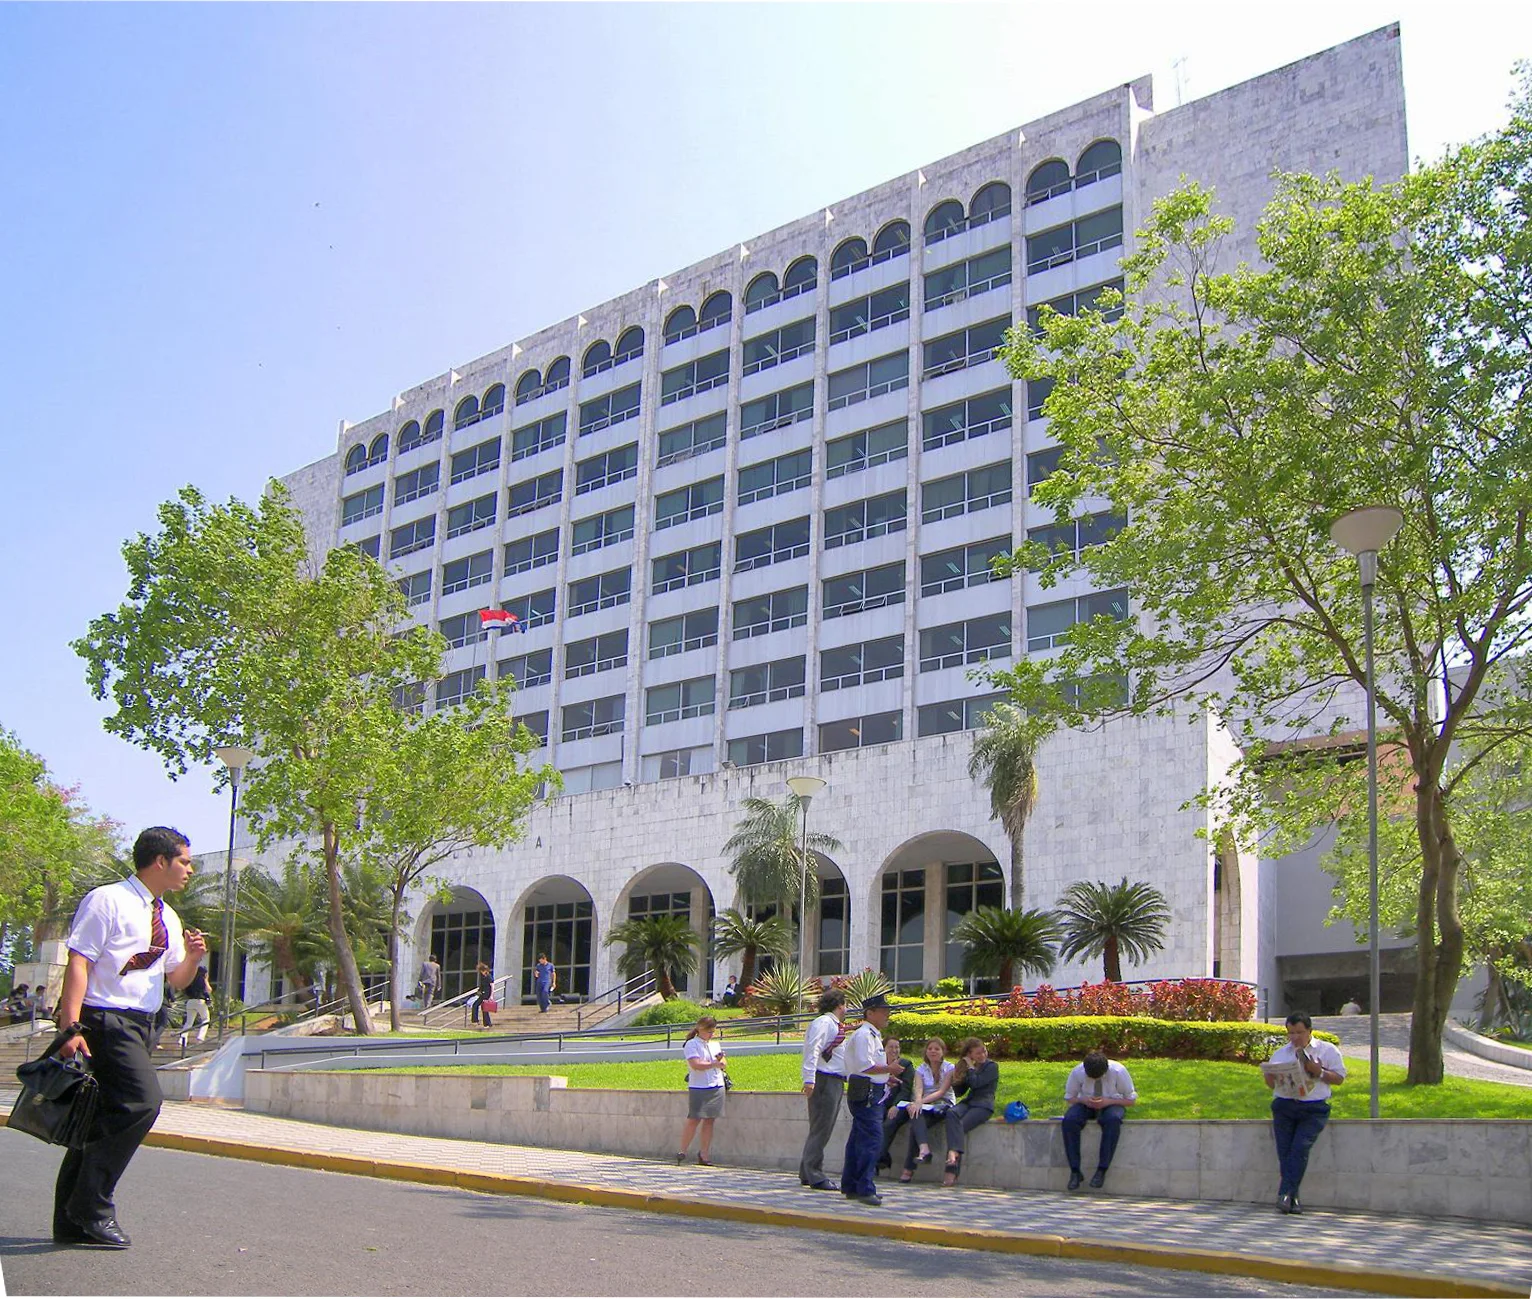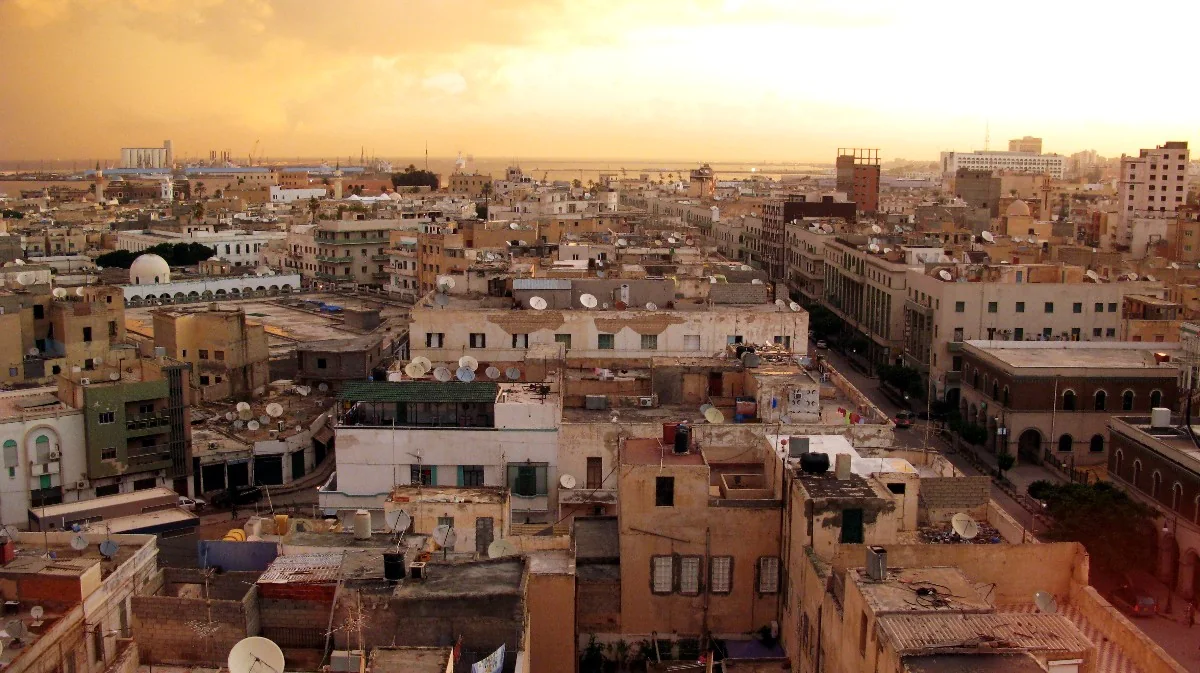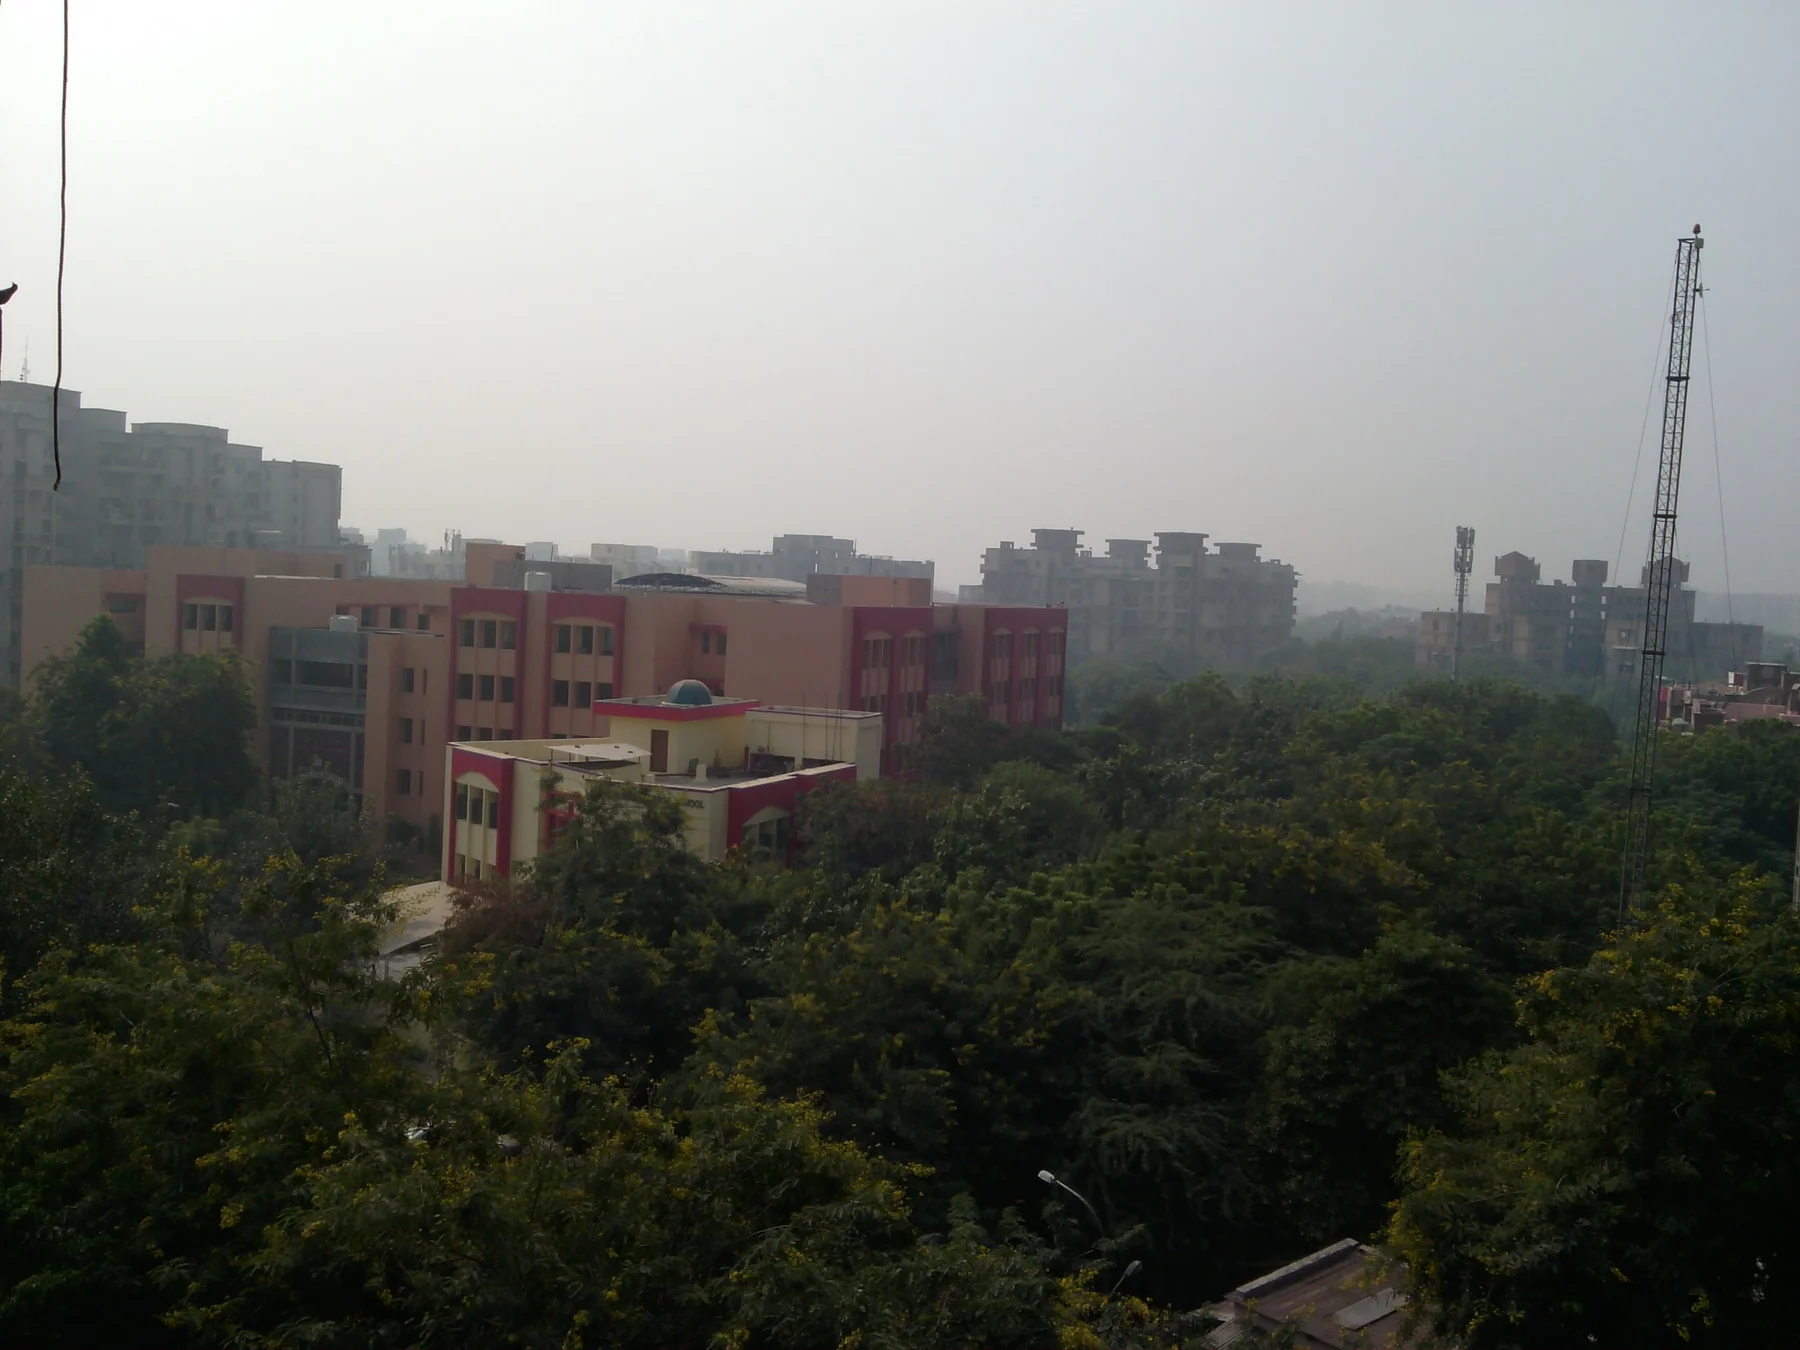
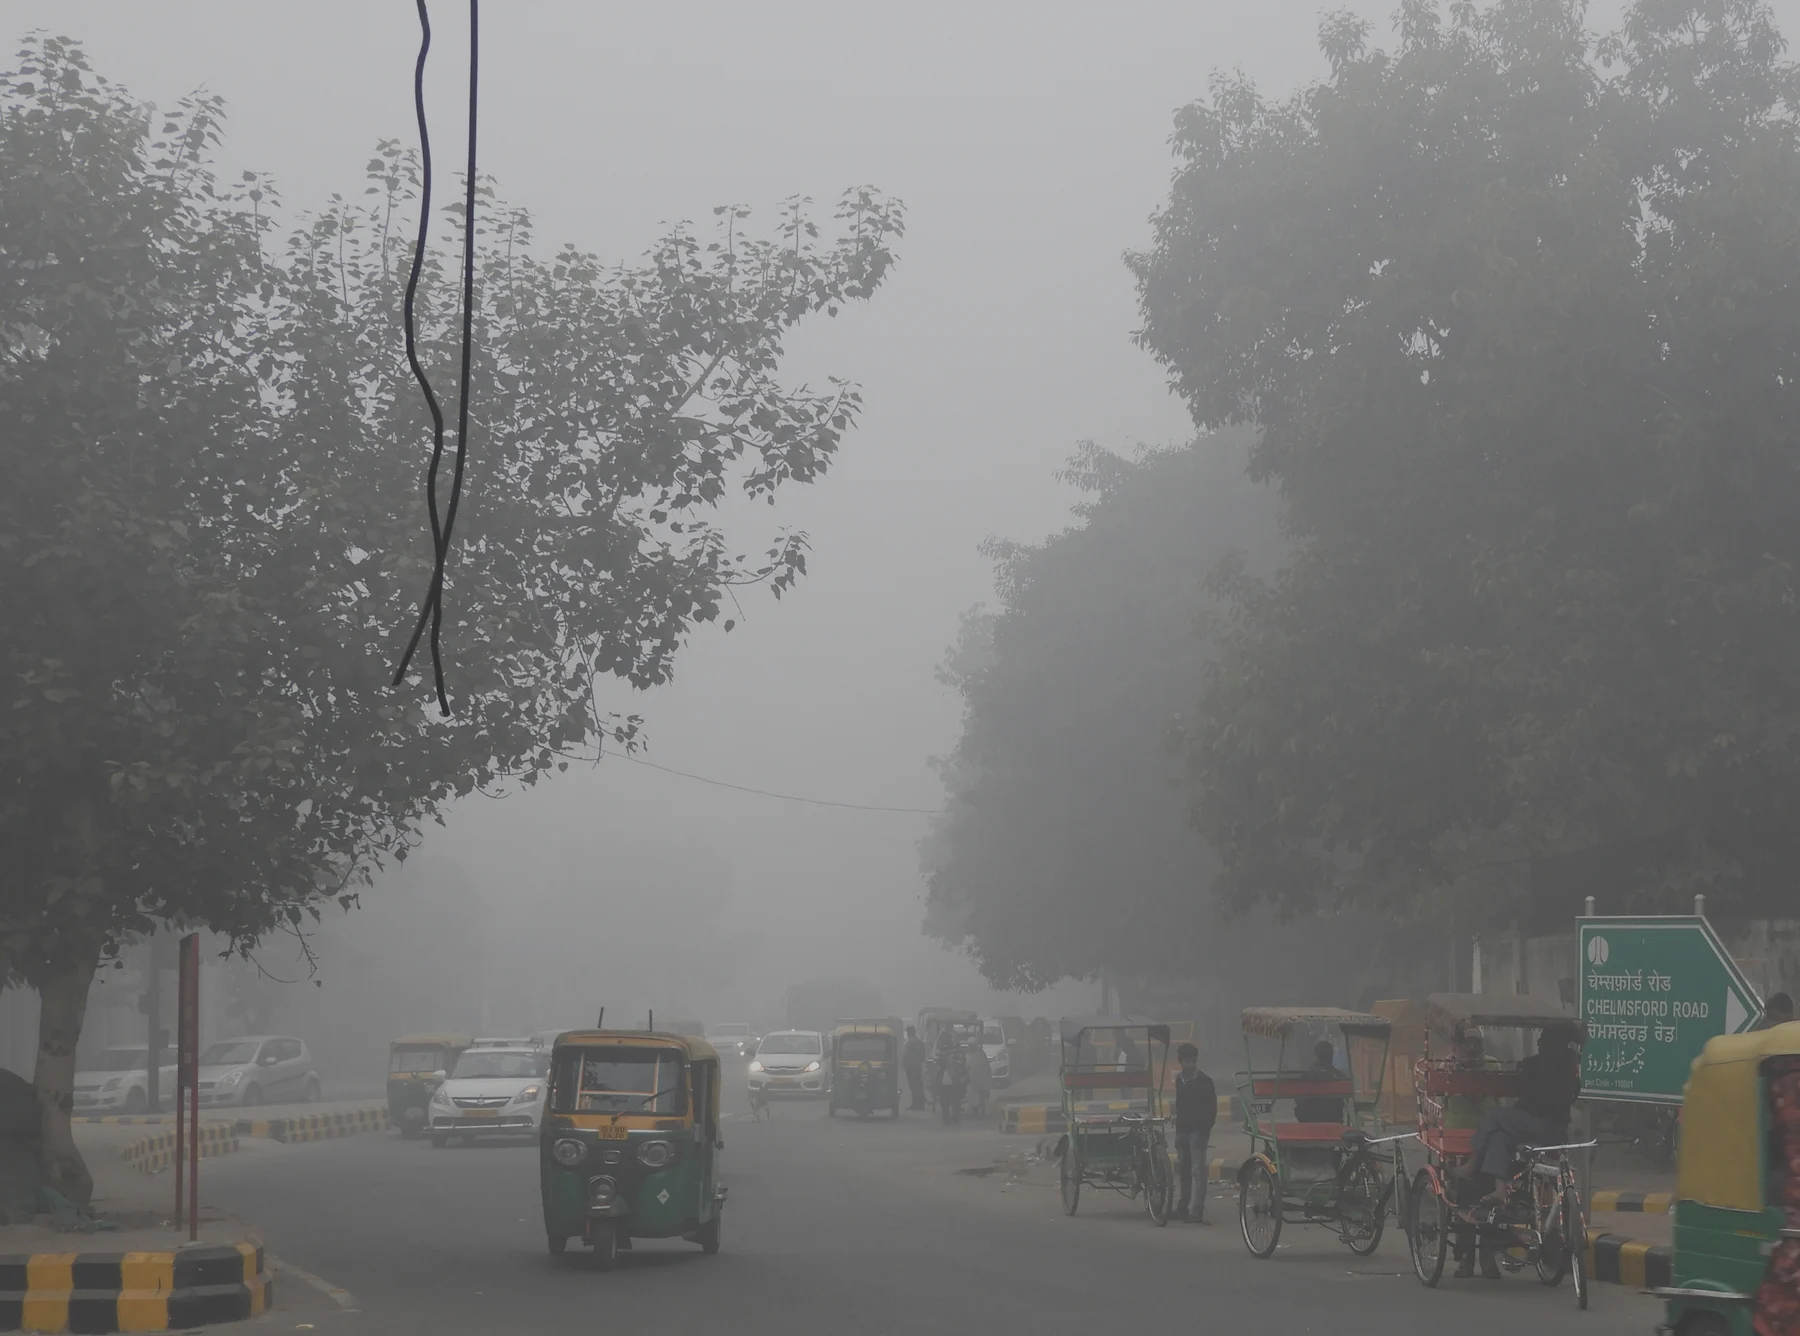
The Nov. 8 station counts and 376 daily average are from The New Indian Express report, updated at 6:24 p.m. IST and attributed to CPCB; an independently accessible copy of that day’s CPCB bulletin was not located. An earlier search preview/URL carried a different 483 figure, while the updated article body reports 376; this story uses the updated body and distinguishes the daily average from single-station values. CAQM’s Nov. 6 order independently documents a 382 daily average and Stage III activation; Reuters reports the same order’s school and work-from-home measures. Delhi’s live AQI dashboard and the IITM forecast page did not load for direct text verification, so no later post-fireworks city average or forecast outcome is asserted. Current-event images were checked first; the usable photographs are explicitly dated archive context only: Rrthakur22’s Delhi neighbourhood image from Nov. 2, 2017, and Sumita Roy Dutta’s Chelmsford Road image from Dec. 31, 2017. Both are CC BY-SA 4.0. Display copies were proportionally resized to 1,800 pixels wide and converted to WebP at quality 86; no crop or content retouching was applied, and the adaptations are shared under CC BY-SA 4.0.
A city average hides severe pockets
Delhi’s daily average Air Quality Index (AQI) was 376 on Sunday, Nov. 8, in the Central Pollution Control Board’s “very poor” band. But readings varied across the city: 12 of the 59 stations reporting data were classed as “severe,” 22 were “very poor,” and Jahangirpuri recorded the day’s highest figure, 463, The New Indian Express reported, citing CPCB data.
Those figures describe different scales. The 376 is the reported citywide daily average; 463 is one monitor’s reading. CPCB places scores from 301 to 400 in the very-poor category and 401 to 500 in severe. The station counts show that nearly one in five monitors was already above the severe threshold, even as the city average remained 24 points below it.
The same report put Saturday’s average at 369, so Sunday’s figure was seven points higher. Taken together, 34 of the 59 stations were either very poor or severe—about 58%, based on the report’s counts. That calculation does not mean 58% of Delhi residents had the same exposure; monitor readings do not map directly onto every neighbourhood or person.
Emergency curbs came before the festival evening
The Commission for Air Quality Management had invoked Stage III of the Graded Response Action Plan across the National Capital Region on Nov. 6, after Delhi’s daily average reached 382 and forecasts warned that pollution could worsen. Stage III adds emergency measures to the earlier steps; Reuters reported that schools were offered online classes and authorities urged offices to consider remote work and residents to postpone private gatherings.
The New Indian Express report also forecast severe air on Monday as Diwali celebrations, vehicle emissions and the seasonal peak in crop-residue burning converged. That was a forecast, not a recorded Monday outcome in the evidence reviewed here.
Fireworks can add particulate pollution, but they sit on top of a broader seasonal mix. Reuters reported that cold, stagnant conditions can trap traffic emissions, construction dust and smoke from crop-waste burning near the ground. CAQM attributed its earlier deterioration to poor pollutant dispersion under unfavourable weather.
What the number can—and cannot—say
AQI turns measured concentrations of pollutants into a scale that can be compared with public-health categories. A daily average smooths changing conditions over time; a station reading captures one location. Neither alone describes the exact air a person breathed at a particular hour or the source of the particles measured there.
The Sunday report’s gap between the city average and several severe station readings is why a single headline number can understate local peaks. It also cannot show how much of the day’s pollution came from fireworks versus transport, weather or other sources. No later CPCB bulletin or post-fireworks city average was accessible for this report, so those outcomes are left open.
Sources
3 references
- The New Indian ExpressDelhi’s AQI remains ‘very poor’ at 376, several areas record severe pollutionReports the Sunday city-average AQI of 376, the 59 monitoring stations, 12 severe stations, 22 very poor stations and a peak of 463 at Jahangirpuri. The report attributes the data to CPCB; its article was updated at 6:24 p.m. IST. · 2026-11-08
- Commission for Air Quality ManagementCAQM invokes GRAP III in Delhi NCRPrimary order record: Delhi’s Nov. 6 daily average AQI of 382, the forecast of severe air, and immediate activation of Stage III measures across the NCR alongside Stages I and II. · 2026-11-06
- ReutersIndia orders Delhi schools to offer online classes as air quality worsens ahead of DiwaliIndependent reporting on the Nov. 6 restrictions, school online options, work-from-home encouragement and sources of Delhi’s seasonal pollution, including traffic, construction dust, crop-waste smoke and stagnant weather. · 2026-11-06